
Author: Wu Min is the Vice President of Product at Nebula Graph, an open-source distributed graph database. After earning his PhD at Zhejiang University, he worked at Alibaba Cloud and Ant Financial for years. He has also been active in academia.
When evaluating companies and stocks, many investors might argue that the more data you have, the better. Furthermore, the more information you might be able to correlate, the better as well. As a result, the industry is increasingly turning to machine learning and graph databases. But how can this help in finance to determine stock performance?
A financial firm can use a graph to analyze stock performances with machine learning. A user could visualize the changes in correlation between some or all stocks, say the S&P 100 Index, over time. While a graph would extract and visualize data for users, a graph database would store and process the raw information. This approach removes technical barriers for data analysis so big data can be used by more people across business sectors.
Big Data Processing

In one possibly useful example, a financial firm can evaluate how companies and their stock performances might correlate over a given time. This can help uncover whether time and their industries have an impact on stock performances. You might gain insights to whether holidays, or other significant time periods, have impacts. This is just one example of many potential insights that can become possible with big data through graph database analysis.
Over the past several years, data sets that financial firms house have become immensely large. They can contain millions to billions of data points. In most cases, mining the data for meaningful insight has surpassed what traditional database technology can muster. Therefore, though graph databases have been around more than a decade, graph database technology has recently reemerged.
What is a Graph Database?
Graph databases are fundamentally different because of their ability to connect data from different tables without the performance penalties of traditional databases. So, we can take data from one place, join it with data in other places, and uncover how it might relate.
To put it another way, in a traditional database, we might use it to call up every stock in the software category. And you get just that, a list of every stock in the software industry. But with a graph database, financial firms can uncover if one software stock correlates in performance to another one, and if they do, is it because of a specific time period, or because of a specific event, or because they are both headquartered in a specific region, or any combination of these, and more. And this can be done for millions to billions of such instances. As a result, data sitting in different silos that were previously useless, now become opportunities for meaningful uses.
A query like this can be done in a millisecond in a graph database. In a traditional database, such a transaction with millions or more data points, the response time will be much longer. Furthermore, as the number of data points and hops to other data sets increases, performance degrades. In a query with multiple hops into other data sets, the difference could be hours of waiting. With such technology, real-time financial insights become possible, in an industry where seconds matter.
The business benefits stretch beyond finance. There are applications in cybersecurity, ecommerce, healthcare and more. Essentially, these industries use graph databases because it allows them to investigate how massive amounts of data relates to each other.
Looking into Stock Relationships
Coming back to how a financial firm can assess stock relationships, we might start by looking into a specific period, say 2015 to 2020. You can then define the stocks, their categories, and other such details. Then a user can use a graphical user interface to visualize the changes in correlation. You can start to see stocks in the same sector being assigned the same color, for example.
Each color represents a different industry for a given stock. And so, stocks with high business similarity get clustered together.
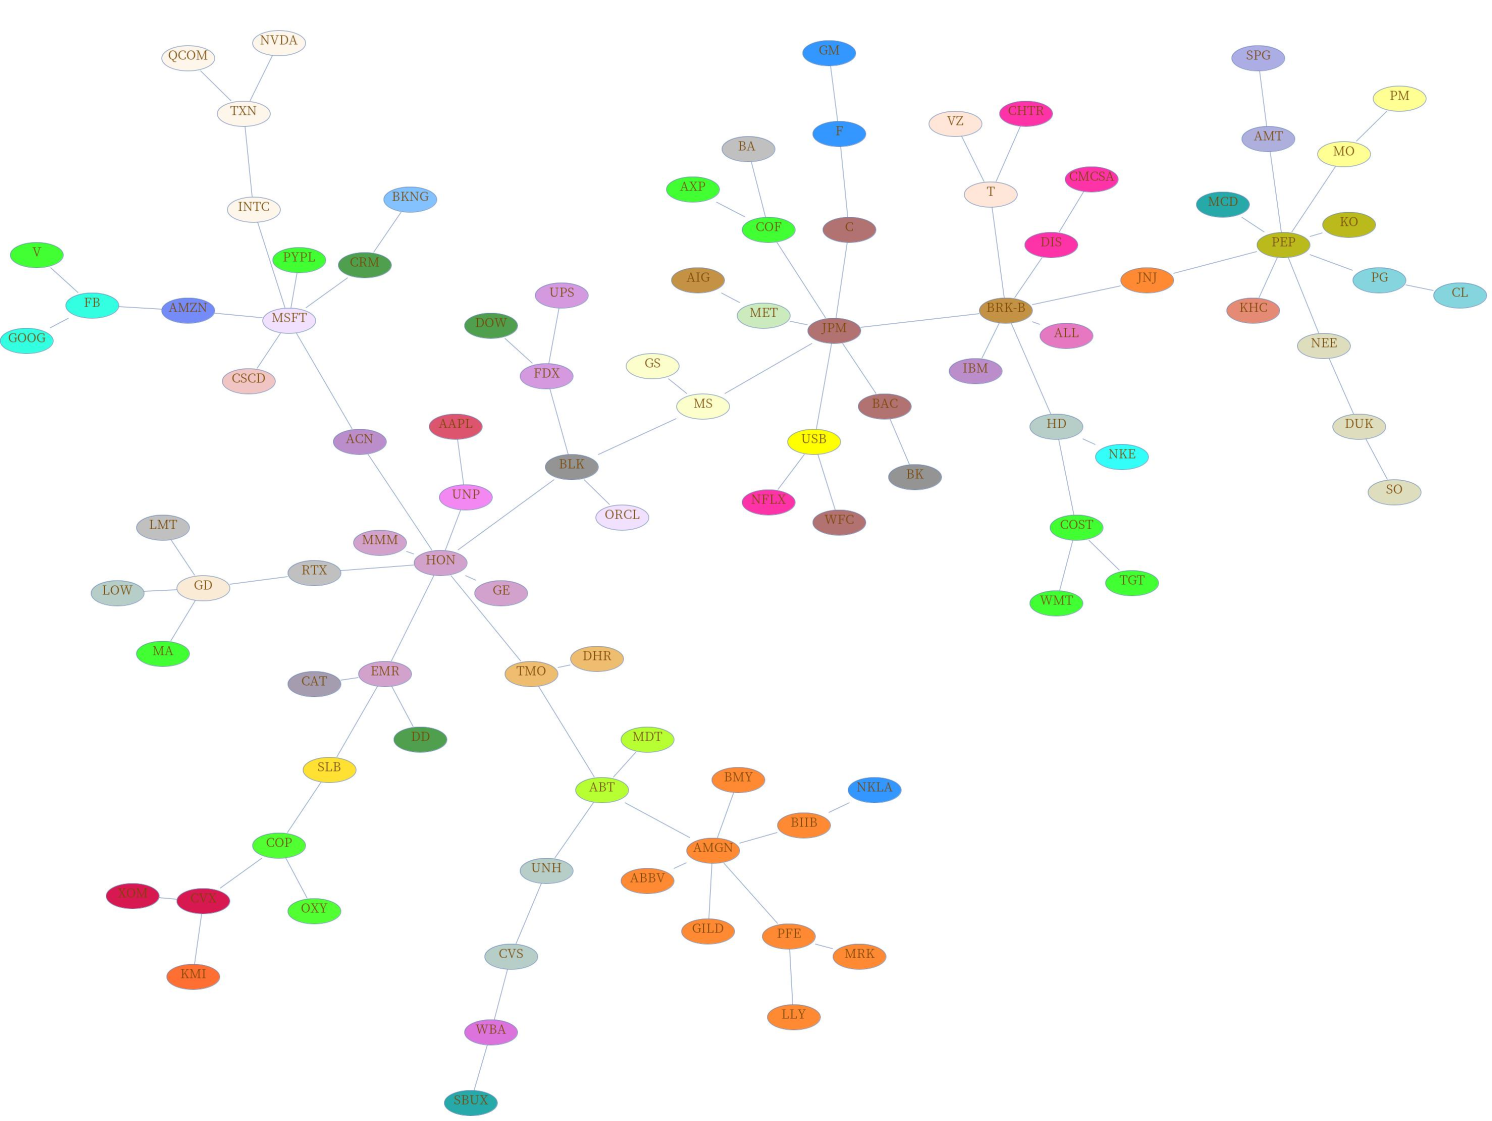
An Example of a Visualization of Stocks Clustered by Business Category or Industry
Now other plots can be made to observe how the clustered groups would change over different times. In the real-world data set used here, it was uncovered that across all the time windows, the clustering of stocks within most industries remained well maintained, even over time. In other words, even over a change of time, all kinds of stocks within the same industry maintain a relatively high correlation in performance.
Such correlations are just the tip of the iceberg for how companies are using graph database technology today. The importance of revealing meaningful data using this technology has spawned new positions in data scientists, data architects, and more in the finance industry. These positions were practically unheard-of roles just a decade or so ago. But big data in fintech is a well-proven market, and the information uncovered with it is helping organizations advance their performance.